ASUS P8P67 DeluxeB3 mobo Temp/Fan monitor questionPost Date: 2011-08-15 |
Post Reply 
|
| Author | |
bakerac 
Newbie 

Joined: 26 Jan 2011 Online Status: Offline Posts: 38 |
 Quote Reply Quote Reply
 Topic: ASUS P8P67 DeluxeB3 mobo Temp/Fan monitor question Topic: ASUS P8P67 DeluxeB3 mobo Temp/Fan monitor questionPosted: 15 Aug 2011 at 7:11pm |
|
My question is about the CPUID Hardware Monitor display on the right of my screenshot.
The mobo is occasionally putting out "bad" monitor points for the voltages, and especially the mobo temps and fan speeds - reading either high (65535) or low (0) occasionally. This particular display is showing the highs and lows after 5.5 days of continuous operation and uptime. With these anomalies, the min voltages, temps and fan speeds, and most max temps and fan speeds displayed by CPUID HW monitor are useless. Does anyone know if this is just the hardware or firmware on the mobo doing this? Is there a defect involved? I also realize that built into the ASUS AI Suite, part of which is shown displaying the CPU speed, is a graphical monitor history one can turn on with temps, fan speeds and voltages. If there are glitches, it will quickly reset itself. But, that's not as convenient as the simple min/max/current readings from the CPUID Hardware Monitor. ============================== Background and other stuff: For comparison, the non-ASUS compontents being monitored don't seem to exhibit the same anomaly - the Intel CPU temps seem to track a reasonable high and low The High temps are when the room got a little warm; the low temps are for the few minutes when the Folding at Home SMP software is finished with one of its 2.2 day long processing sessions and is uploading a finished "work unit" and then downloads the next work unit to chew on. - The Seagate momentus hybrid SSD/HDD temps are consistent - the Nvidia temp/fan readings are all as expected - the 60/62 deg C temps are during the times when the GPU is processing a work unit, and the 30 deg c min temps are when it uploading results and downloading the next work unit. As I've posted before, I leave the system on 24x7 running an "SMP bigadv" instance and a "GPU" instance of Stanford University's "Folding at Home". The software tucks nicely in the background allowing me to do pretty much anything with the system I need, but greedily scarfs up almost all the unused processing cycles. --Fan config: top and front 200mm blowing in; side 200mm & back 120 mm out --i7 2600K @4.310GHz
--Noctua NH-U12P CPU Cooler --ASUS P8P67 DeluxeB3 --4GB ADATA 1600/8 GB Corsair 1600 --750W Corsair PS --Seagate Hyb 500GB--WD Caviar Black 1TB --MSI 560GTX-Ti Twin Frozr GPU@950MHz --Win7Home64 GPU3 v6.41 Systray SMP2 v6.34 console 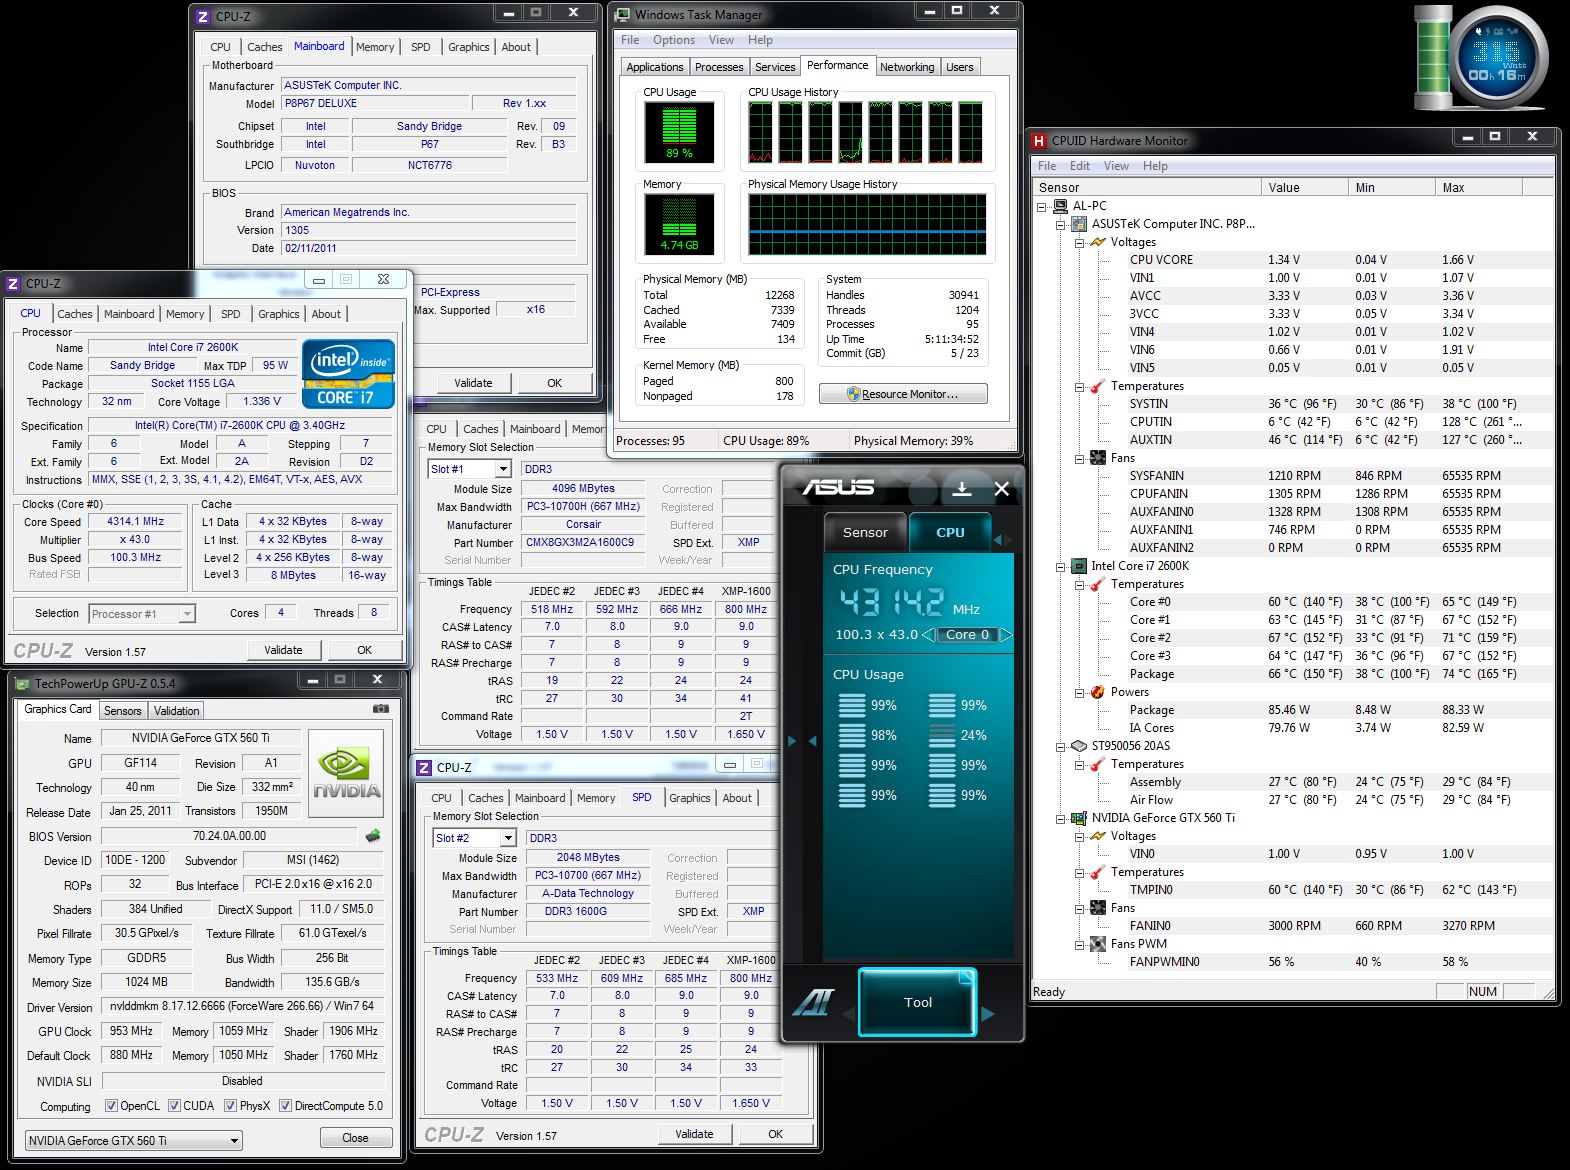 |
|
 |
|
|
RiceEatin2000GT
DS Veteran 
Joined: 02 Oct 2008 Online Status: Offline Posts: 1699 |
Quote Reply
Posted: 16 Aug 2011 at 3:31am |
|
temp monitoring programs like that showing weird reading for different fans is pretty normal. I wouldn't worry about it, just monitor your cpu/gpu temps and you'll be fine.
|
|
|
|
|
|
|
RiceEatin2000GT
DS Veteran
Joined: 02 Oct 2008 Online Status: Offline Posts: 1699 |
Quote Reply
Posted: 16 Aug 2011 at 3:34am |
|
the only thing i see after looking over your screen shots is your max v-core voltage of 1.66. if it is in fact getting that high your cpu will die in a matter of days/weeks. Run linx or prime95 and keep cpu-z open and see what voltages your getting.
edit- it seems like even the min value is way to low so it would lead me to believe its reading incorrectly. Just verify it with cpu-z and possibly trying seeing if theres any updates to the version of hwmonitor you are using. Edited by RiceEatin2000GT - 16 Aug 2011 at 3:36am |
|
|
|
|
|
|
|
Alex
Admin Group 
Digital Storm Supervisor 
Joined: 04 Jun 2012 Online Status: Offline Posts: 16314 |
Quote Reply
Posted: 16 Aug 2011 at 2:02pm |
|
Those values are definitely wrong. The max CPU VCORE your system had during LinX/Prime95 testing was 1.32v.
|
|

|
|
|
|
|
bakerac
Newbie
Joined: 26 Jan 2011 Online Status: Offline Posts: 38 |
Quote Reply
Posted: 16 Aug 2011 at 7:41pm |
|
Thanks for your comment, Alex.
I've added some overclock since I've had the system, but it's been in the current config for well over a month now running 24/7. I've also been setting the "sensor recorder" in the ASUS AI Suite software every day or so to save the temp/fan/voltage parameters for the next 24 hours. I went back over the last several days of data this morning, and found that the Vcore sits rock solid at 1.336 v, with some very small excursions over maybe 1.329 to 1.341 for a period of 10 seconds or so, then back to 1.336. Anyway, my question of the comminity is whether there had been any other reports of this kind of status reporting glitch that CPUID HW monitor has been seeing (and, BTW, also seen in the ASUS AI suite if I'm looking)? Everything SEEMS to be working OK, but just like NASA and the space shuttle, I feel nervous when there is a glitch in the status reports - is it the reading, or is there something going on? BTW, I've just reset the CPUID HW Monitor min/max - we'll see what the next period brings. I'm seeing that after 10 minutes or so, the max fan speeds are all reading bogus high values - 65535, 49663, or 65282. The Vcore has remained steady at 1.34 v, but there must have been a reporting glitch in the min voltages - all the other min mobo voltages are reading 0.05, 0.10, 0.01 - values that couldn't be real.
|
|
|
|
|
RiceEatin2000GT
DS Veteran
Joined: 02 Oct 2008 Online Status: Offline Posts: 1699 |
Quote Reply
Posted: 17 Aug 2011 at 2:31am |
|
i wouldnt stress over it
|
|
|
|
|
|
|
|
Post Reply
|
| Forum Jump | Forum Permissions You cannot post new topics in this forum You cannot reply to topics in this forum You cannot delete your posts in this forum You cannot edit your posts in this forum You cannot create polls in this forum You cannot vote in polls in this forum |
About Digital Storm
Contact Information
Facility Tour
Financing
Buy Now, Pay Later
Downloads
GSA Schedule
Terms & Conditions
Privacy Policy
Request Help
Call: 1-866-817-8676
(Hours 9AM-5PM PST)
![]()
![]()
![]()
![]()
![]()


 Topic Options